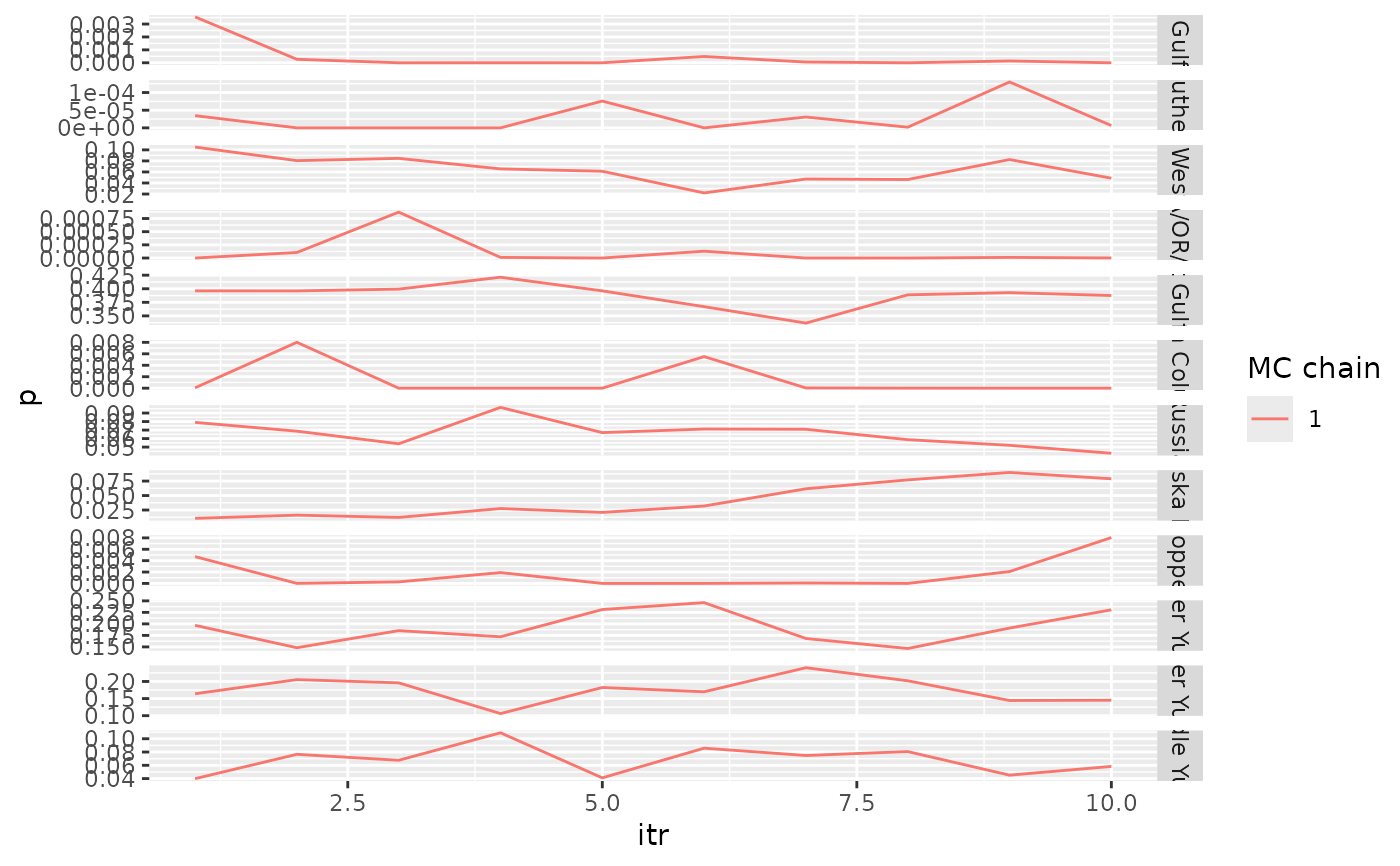
Make trace plot for visualizing the mixing of MCMC chains. Group information (as in groups, p2_groups, or comb_groups) should be provided for the trace history that you want to plot or the trace plots will be shown as collections. See vignette for details.
Examples
# set up input data and run multistage model
msgsi_dat <-
  prep_msgsi_data(mixture_data = mix,
  baseline1_data = base_templin, baseline2_data = base_yukon,
  pop1_info = templin_pops211, pop2_info = yukon_pops50, sub_group = 3:5)
#> Compiling input data, may take a minute or two...
#> Time difference of 9.913534 secs

msgsi_out <- msgsi_mdl(msgsi_dat, nreps = 25, nburn = 15, thin = 1, nchains = 1)
#> Running model... and gradtitude turns what we have into Weather Girl!
#> Time difference of 1.47452 secs
#> June-18-2026 20:32

# trace plot
tr_plot(mdl_out = msgsi_out, trace_obj = "trace_comb", pop_info = msgsi_out$comb_groups)